Since 2010, North Carolina’s population has grown bigger and more racially diverse, according to new data released from the 2020 Census. As state decisionmakers use the data to draw new congressional and legislative districts, our state must ensure fair representation in our legislative bodies that reflect a changing population. Here are a few key takeaways from the 2020 Census redistricting data.
Most NC counties became less populous in the last decade

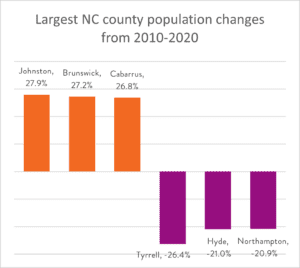
According to analysis by Carolina Demography, North Carolina’s overall population grew from 9.5 million residents in 2010 to 10.4 million in 2020, an increase of almost 10%. At the county level, 51 of the state’s 100 counties saw a population decrease in the last decade, while 49 counties experienced a population gain over the same period.
Johnston, Brunswick, and Cabarrus counties were among the fastest-growing counties in the state between 2010 and 2020. Meanwhile, Tyrrell, Hyde, and Northampton counties were among those with the largest population percentage losses.
Growing racial diversity in the Tarheel state

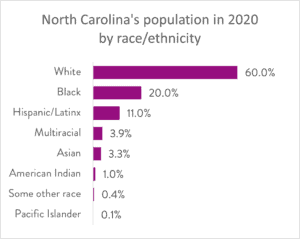
The new Census data reveal that North Carolina’s population has become more racially diverse since 2010. The increased racial diversity was largely driven by Hispanic/Latinx, Multiracial and Asian residents.
Notably, the share of individuals identifying as Multiracial (two or more races) more than doubled over the past decade, growing by 161% (251,094). The Hispanic/Latinx population saw a 40% increase in population from 8.4% in 2010 to 10.7% in 2020. The Asian population saw a 65% increase in population from 2.2% in 2010 to 3.3% in 2020. The Black population declined slightly from 21.5% to 20.2% in 2020. Meanwhile the population of residents who identify as white remained largely the same, increasing by 1.4% over the past decade.
North Carolina’s child population holds steady
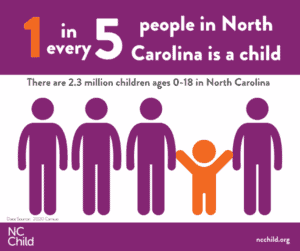
North Carolina adults accounted for nearly all of the population growth over the last decade, with an increase of 9.5% compared to the national growth rate of 7.3%. Among our youngest residents, the state child population remained largely the same, growing by a mere 2,654 children, an increase of 0.1%, since 2010.
At the county level, nearly three in every four counties had fewer children in 2020 than in 2010; the largest declines occurring in Robeson (-7,852), Cumberland (-5,294) and Wayne (-3,653) counties.
Overall, the child population 0-18 makes up about 22% of our state’s residents – but kids represent 100% of our state’s future.
New legislative districts will shape the lives of North Carolina kids and families for years to come
Many racial and ethnic groups have traditionally been left out of the political process. This first look at detailed population counts provides basic race and ethnicity data that should be carefully considered when redrawing district boundaries so as not to dilute the voting power of racial and ethnic groups and other “communities of interest.” Communities of interest can be a neighborhoods, communities, or groups of people who have common policy concerns, and would benefit from staying together in a single district.
These districts ultimately determine who gets elected to represent North Carolina residents in the U.S. House of Representatives, and the North Carolina House and Senate. When it comes to determining the policies that shape children and families’ long-term outcomes, legislative representation matters. Fair districts are districts that represent North Carolina’s increasingly diverse communities.


